UTU SEP Products: High-energy solar proton events
SEP Catalogue
This product provides a catalogue of high-energy solar proton events. It is based on the observations in the 55-80 MeV energy channel of the SOHO/ERNE instrument. The catalogued time period runs from May 1996 until the end of March 2022.
The event list has been produced by systematic visual scanning of the data. An event is identified, when the 1-min-averaged 55-80 MeV proton intensity exceeds the pre-event background by a factor of about 3. All candidate events are then analysed for solar associations and cross-checked against other catalogues (e.g., Cane et al. 2010; Papaioannou et al. 2016). For the increases believed to be of solar origin, a thorough analysis is performed. For each event, we determine the onset time in the 55-80 MeV proton channel using the Poisson-CUSUM method (Lucas 1985), the peak flux in the 55-80 MeV channel, and the end time of the event in the 12.6-13.8-MeV proton channel, thus making sure that the total duration of the event includes the relevant periods of time for the proton fluence analysis, which is also performed for each event. In addition to ERNE observations of energetic protons, complemented with SEPEM RDS (v. 3.0 beta, courtesy of ESA/HIERRAS project) proton data in the case of event proton fluences, we analysed ERNE observations of heavy ions (including saturation correction with SEPEM RDS helium data), ACE/EPAM electron observations, GOES X-ray observations, and CME-related observations available in the SOHO/LASCO CME catalogue (Gopalswamy et al. 2009). Note that due to the change of instrumentation on-board operational GOES satellites since early 2020, the SEPEM RDS proton dataset cannot be continued past this point. It is replaced with the GOES / SPGS observations after the change (events 181–192). The SEPEM RDS He data is also not available for ERNE heavy-ion saturation correction after that date. For those affected events that have ERNE heavy-ion data available (183–185) this is not regarded to affect the result.
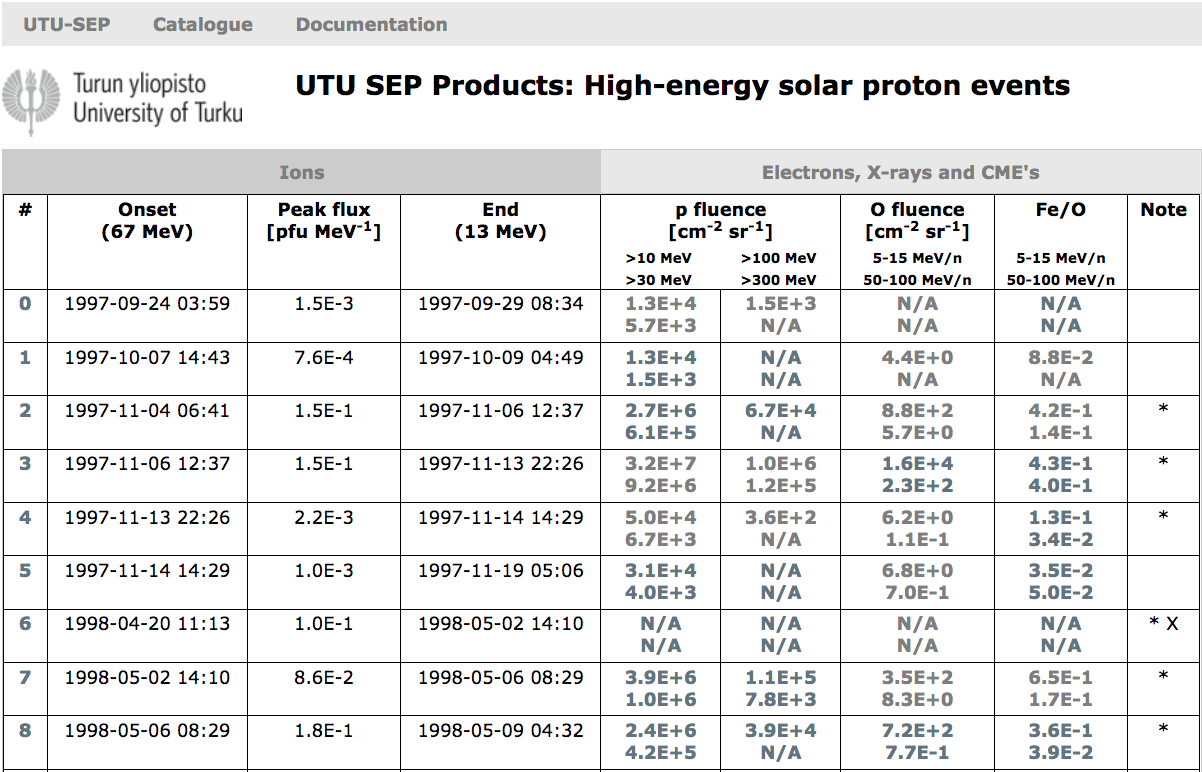
The results of the analysis are presented in form of a catalogue with tabulated numeric information. The tabulated data is split in two separate tabs, one showing ion observations and the other one the electron, X-ray and CME observations. The following columns are presented:
Ions:
#: Event number, starting from 0
Onset (67 MeV): Onset time of 67 MeV protons measured by SOHO/ERNE
Peak flux [pfu MeV-1]: Time of maximum intensity of 67 MeV protons
End (13 MeV): End time of the event in the 13 MeV proton channel
p fluence [cm-2 sr-1]: Proton fluences for the >10 MeV, >30 MeV (in the left-hand sub-column), >100 MeV, and >300 MeV (in the right-hand sub-column) energy channels
O fluence [cm-2 sr-1]: Oxygen fluences at 5-15 MeV/nuc and 50-100 MeV/nuc
Fe/O: Iron to oxygen ratios at 5-15 MeV/nuc and 50-100 MeV/nuc
Note: Notes related to ion observations, explained at the bottom of the Catalogue.
Electrons, X-rays and CMEs:
Electron Onset: Onset time of the 175-315 keV electrons measured by ACE/EPAM
Peak e flux [pfu MeV-1]: Time of maximum intensity of 175-315 keV electrons.
X-ray Onset: Soft X-ray onset time of the associated GOES X-ray flare
Max. dI/dt: Time of maximum of the time derivative of the X-ray intensity of the flare
Class: GOES X-ray class of the associated X-ray flare
Lat.: Latitude of the associated solar flare
Lon.: Longitude of the associated solar flare.
1st C2 Obs: Time of first LASCO/C2 observation of the associated CME
Speed [km s-1]: Plane-of-Sky speed of the associated CME
PA [°]: Position angle of the associated CME
W [°]: Angular width of the associated CME.
note: Notes related to the electron, X-ray and CME observations, explained at the bottom of the Catalogue.
The tabular information is accompanied by the following figures, linked to the information in the columns, showing the event properties:
An overview of the proton event. ERNE proton intensities with 1-minute time integration in five energy channels are shown in the upper panel; GOES soft X-ray flux, smoothed with 5-minute sliding average, in the lower panel.
Integral spectrum of proton fluence integrated over the event for energy channels greater than 10 MeV, 30 MeV, 100 MeV, and 300 MeV. Shown in the figures are results derived from both SOHO/ERNE (red symbols) and SEPEM RDS or GOES/SGPS (blue symbols). Estimated 12-hour pre-event background intensity is subtracted from each channel of ERNE data. SEPEM RDS fluxes are readily obtained as background subtracted values for time periods with the flux above background level. ERNE is far more sensitive than GOES instruments that are used for the SEPEM RDS. Thus, in the smallest events, SEPEM RDS (GOES/SGPS) fluence may be missing from the plot or is well below the fluence level observed by ERNE. On the other hand, in the largest events, SOHO/ERNE may be saturated and in those the SEPEM RDS (GOES/SGPS) fluence is typically higher than ERNE fluence. Therefore, the tabulated value in the catalogue is the higher of the two available fluence values in each overlapping energy range. Note that for the >300 MeV energy range, SEPEM RDS (GOES/SGPS) data are used exclusively.
Differential background subtracted oxygen fluence observed by ERNE at five (log-spaced) energies in the range of 3.125-100 MeV/nuc. Backgrounds are estimated as the mean intensity of each 50-day interval, omitting event periods. If the background subtracted fluence is zero or negative, 1-count fluence is shown instead (grey triangle). Statistical errors, including the background, are shown with vertical errorbars. Note that catalogued oxygen fluences are given in broad energy channels in integral units [cm-2 sr-1] while the plots present differential fluences [cm-2 sr-1 (MeV/n)-1] with a larger number of channels.
Nuclear charge spectrum of ions heavier than boron in the energy range 5–15 MeV/nuc. No background is subtracted.
The soft X-ray observations of the event juxtaposed with the particle observations. ERNE proton intensity and ACE/EPAM electron intensity, both quantities back-shifted in time to allow direct comparison with EM radiation; the time derivative of the soft X-ray flux, calculated using 5-minute sliding average of the GOES X-ray intensity data; GOES X-ray intensity, smoothed with 5-minute sliding average. In cases where a flare is known to be associated with the particle event, the maximum of the X-ray intensity time derivative during that flare is marked with a vertical red line, crossing all the panels.
User instructions
When entering the product, the user will arrive at the catalogue website with the following interface:
Catalogue items displayed in bold-faced grey font are links to figures describing the event, as listed above. Clicking on the link will open the figure in a separate pop-up window/tab in the browser.
The catalogue has two separate tabs, one containing information on ions and the other one containing information on electrons, X-rays and CMEs. Scrolling the table downwards will allow one to access all the more than 170 events in the table. The catalogue header will be visible all the time during scrolling. The user can switch between the tabs anywhere in the catalog to see the content of the other tab for the same events that he/she has visible in the present tab. At the bottom of the Table, the user finds a list of table notes that explain the contents of the last columns of the two tabs.
The SEP events 0 to 173 in SEP Event Catalogue (R.130) can also be accessed for further analysis through the SEPServer application. SEPServer requires a separate user registration and is not part of the ESA Space Weather Service Network.
References
Cane H.V. et al., 2010, Journal of Geophysical Research, 115, A8, A08101Gopalswamy N. et al., 2009, Earth, Moon, and Planets, 104, 295–313
Lucas J.M., 1985, Technometrics, 27, 2, 129
Papaioannou A. et al., 2016, Journal of Space Weather and Space Climate, 6, A42